


Elections, Covid, and Synthetic Control Models: Contra CRRC
What really caused 100000 excess cases in Georgia? It wasn't elections - it was the delay in public health interventions

The Caucasus Research Resource Center (CRRC) in Georgia has published a policy bulletin (.pdf) by Dustin Gilbreath and Givi Silagadze (henceforth G&S) which attributes up to 140,000 cases and up to 1450 deaths to the Parliamentary elections on October 31st, 2020. This piqued my interest because it was a very stark contrast to my previous analysis, which suggested that the data were inconclusive and could not clearly demonstrate any connection between elections and covid cases at all. I enjoyed the process of investigating the bulletin and its methodology, replicating the experiment using the authors’ code, and thinking about why and how the authors came to their conclusions.
That said, as the title of this post indicates, I am not convinced that the analysis supports the conclusions. In this article I’ll review the data and methodology to explain what I think G&S missed. I think the analysis is still quite useful in the sense that it gives us an idea of how badly Georgia mismanaged its second wave, even if I do not agree that the elections were the causal or mediating factor in that mismanagement.
At the outset I’d like to say I appreciate the work the CRRC does and this bulletin is no exception. Their transparency in explaining their methodology and publicly posting their code and data is important and praiseworthy, and I absolutely share their concern about the impact of elections on public health. The upcoming elections should be held with all possible precautions, including masking, ventilation, and social distancing, especially in indoor spaces.
What is a Synthetic Control Model?
Whenever possible, scientists use controlled experiments to determine the effect of a particular intervention (called “treatment” here). Suppose you want to measure the impact of masks on covid transmission. You could give one group of people masks (the treatment group) and another group of people nothing (the control group), and then observe both groups and measure the rate of new infections. This is essentially what was done in the Bangladesh mask study, released earlier this month. As the article states, the researchers found that “the number of symptomatic cases was lower in treatment villages than in control villages”. The “treatment” consisted of going around the treatment villages and giving out masks as well as training and an explanation of how and why to use the masks, and then having people walk around the villages periodically reminding people to please put their masks on.
We can conclude that masks plus training plus reminders caused the reduced covid numbers in the treatment villages because we can compare them to control villages, where no treatment was done. We can make a valid inference that since one Bangladeshi village is more or less similar to another with regard to factors that might influence covid transmission, any difference in transmission must be due to the treatment and not to some other difference between the villages.
But what if you have no control villages? What if every village were significantly different - with a different population, population density, population structure, government type, temperature, air pressure, humidity, climate, altitude, latitude, etc? What if every village had different rates of covid transmission at different times, with some villages enjoying relative calm while others suffered from major surges, and vice versa, with no apparent rhyme or reason? How, then, would you determine the impact of a treatment?
What if you performed the treatment at the beginning of spring, and then cases went down - how would you know if it was the treatment that caused the decrease, or the change in temperature, or both?
The synthetic control model is an attempt to solve these problems. The key idea is that if you can’t find a real control group, you can just use a virtual one. The virtual control group will be built by combining data from various real groups (that’s why it’s called synthetic) into a predictive model. The model is calibrated so that it predicts pre-treatment outcomes in the treatment group using data from the control groups. Then the model is fed data from the control groups after the treatment date, and in theory it will then “predict” how the treatment group would have performed if the treatment hadn’t been administered.
The synthetic model, in other words, is supposedly similar enough to the actual experimental group that we can use the model as a kind of virtual control group.
Limitations of the Synthetic Control Model
While the synthetic control model strikes me as a very insightful idea, and very useful in certain situations, it has a few important limitations which apply in this particular case. One is that its performance is limited by the performance of the predictive model and of predictive models in general. So if - as I suggested in my Peak Predictions post - covid trends in one country are not very good in general for predicting covid trends in other countries, that limitation will carry over, to some extent, to any kind of method relying on building a predictive model. As noted in that post, some countries are repeat outliers - Georgia had two of the world’s highest peaks, and Czechia had three - and this suggests some internal factor within these countries that causes them to have a higher number of higher peaks than other countries. International models might be a good starting point, but they seem to perform worse than models which are more sensitive to specific local conditions. In addition, when past performance is a bad predictor of future performance - as Georgia’s first wave was apparently a bad predictor of Georgia’s second wave - we can’t at all expect correlations to hold between the real treatment group and the virtual treatment group over time.
Another limitation is that this method has no inherent power to sort treatment effects from non-treatment effects - so that, for example, even if the model can show that a country diverged from the prediction by X amount starting at point A, it can’t tell you what specifically it was about point A that caused the divergence.
A related limitation is that the model can’t distinguish between a treatment in its treatment group and a change in the underlying conditions in its control groups. Suppose country A did a mask mandate at the same time as countries B and C opened schools. A model of country A built from countries B and C can’t tell how much of the subsequent difference in covid cases comes from the mask mandate and how much comes from the school openings.
Third, the model seems to be especially poorly-suited for detecting a specific date on which a particular effect originated. In other words, if you build a model based on data leading up to October 31st which diverges wildly in November, then (at least in this case) you can also build a model with data leading up to October 18th which will also diverge wildly in November. In such a case, the model cannot tell you whether the divergence was caused by an event on October 31st or October 18th - or in fact any date before, after, or between these dates.
The implication is that if you happen to know that a single treatment occurred starting on a specific date, the synthetic control model can suggest the effect size of that treatment. If, however, you have any number of possible “treatments” occurring over a span of possible dates, the synthetic control model probably cannot help you narrow down the list to tell you which treatment, if any, was responsible for the effect, or to what extent.
This is already fatal to the CRRC report’s conclusion, though - the model can tell us that Georgia had 100,000 more cases than predicted from November to January, but it can’t tell us why, even in principle. Maybe it was the election, maybe it wasn’t, but the model doesn’t provide any evidence one way or another.
Finally, there may be very different results based on inclusion criteria for control groups. G&S used three different trials with three different inclusion criteria to address this issue. Ultimately, though, it’s not clear that there is any set of countries which would have been predictive of Georgia, so I’m not sure how relevant this particular limitation was in this case.
Control Groups and Stringency
G&S created three sets of inclusion criteria, and created two models from each set. The first of each set of models looked at deaths per million, and the second looked at cases per million.
The model of deaths per million using the first set of inclusion criteria produced the following list of countries, plus seven additional countries at weight 0.1%:

This means that the first model was mostly Tunisia - that is, 60.9% of the deaths per million in the model are Tunisia’s. If most of this model is just data from Tunisia, let’s take a look at Tunisia vs. Georgia during this time period and see if anything jumps out.
First, look at cases per million:

Immediately I notice that Georgia’s pandemic curve starts to diverge from Tunisia’s on October 15th, which was more than two weeks before election day. This is not consistent with the hypothesis that election day caused the divergence.
Now, look at deaths per million:

First, it’s worth noting that Tunisia’s graph here is quite noisy, which makes it hard to draw any conclusions. There’s some divergence towards the end of October, then the graphs cross, and then Georgia’s death rate is much higher starting from November 14th. Death rate seems to lag by 2-3 weeks, so this timeline is a bit tight but does line up with election day. However, it also lines up with the pre-election-day increase which I mentioned above.
Finally, I want to take a look at the stringency index - a measure of how strict, overall, the anti-covid policies are in a given country:

Well. Tunisia’s stringency index leaps from 23 to 49 in early October and then to 54 on October 8th - a week before we notice the divergence between Georgia and Tunisia. Then it jumps again - from 54 to 75 - on October 28th. It looks to me like Tunisia controlled its outbreak by adjusting stringency as needed, and Georgia didn’t, and that fully explains the difference between the two countries. The timing works better since the stringency explanation tells us why the countries diverged from October 15th and the stringency also gives us 17 instead of 14 days lead time on the divergence in death rates, which is more in line with my understanding of the median survival time for covid fatalities.
Of course this is just an alternative interpretation of the same data - but remember, as stated above, that the synthetic control model can’t distinguish between a treatment effect in the treatment country and a policy change in the control countries.
The next two countries - Laos and Cambodia - make up 20% of the model. Both of these countries had an average of 0 new cases per million and 0 deaths per million for the entire period shown on these graphs. In fourth place, Bulgaria, we have another country with a jump in stringency at the end of October. Again, it very much looks to me like what this model is picking up on is just that the control countries put interventions in place while Georgia didn’t, so they had flatter curves while Georgia had an uncontrolled run up to one of the highest peaks in the entire pandemic.
Now, looking at the model for cases per million using same inclusion criteria:

Well, that makes this easy. Cases:

Here you again have a big divergence before election day, then a dip, then a return to trend.

Here the death rates converge during the period 2-3 weeks after election day, and diverge at other times, which is the opposite of the effect we’re looking for.

Again, Hungary raised its stringency significantly between Nov. 3rd and 10th, while Georgia made a much smaller adjustment. This is less clear-cut than Tunisia, but it still explains the data we see at least as well as the hypothesis that a single event in Georgia on October 31st was solely responsible for the difference between these two countries’ pandemic curves - which is what CRRC’s model here is saying.
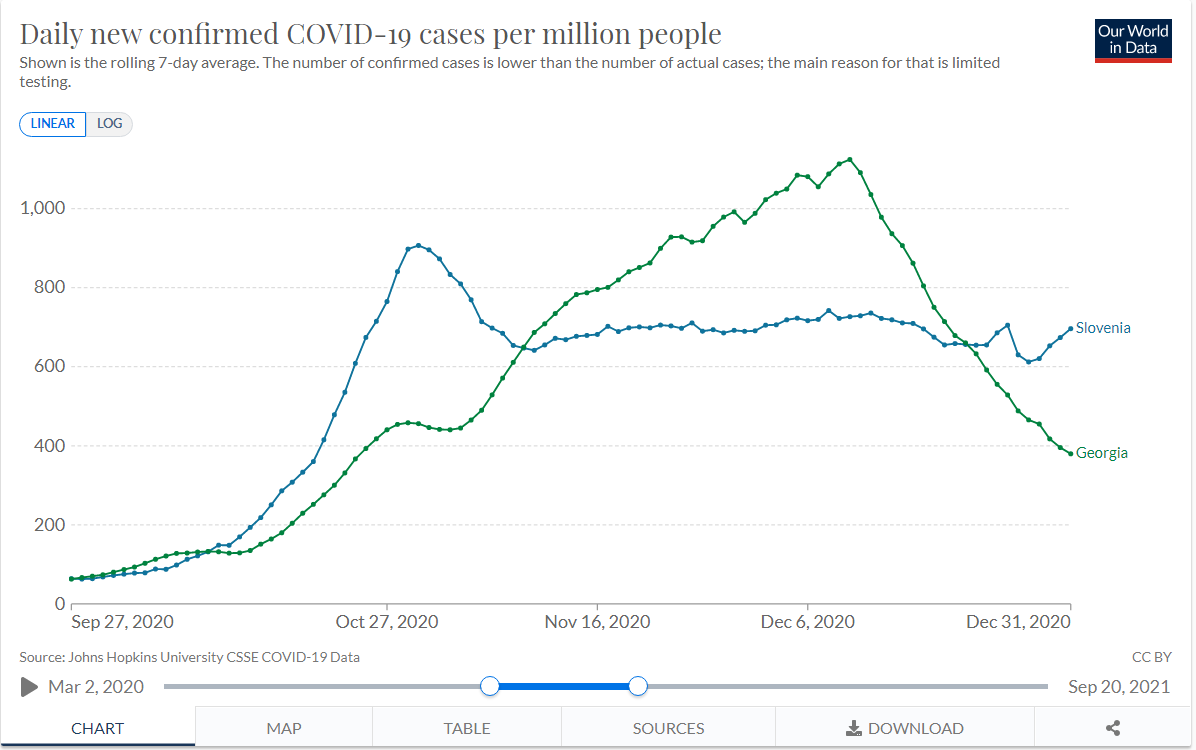
The analysis is similar for the models based on inclusion criteria sets 2 and 3. Tunisia, Bulgaria, and Hungary remain significant donors. Slovenia is added, and…
Stringency jumps up on Oct 19th-20th:

…and cases start dropping ten days later:
It seems increasingly apparent to me at this point that CRRC’s models are mostly just picking up the results of increases in stringency in the control group. This is not surprising - many countries were experiencing a second covid wave at this time, and as a result you would expect that most countries would increase their stringency in response. What’s surprising is that Georgia did not, which is another way of saying that Georgia was an outlier in its second wave, which we already knew.
If anything, what G&S are measuring here is the impact of Georgia refusing to increase its stringency until hospitals hit capacity - a mistake the country repeated in the fourth wave, and with the exact same (well, okay, slightly worse) results.
Replicating the Model on Different Dates
I decided to have some fun so I downloaded R - a programming language and suite used for statistical analysis - and CRRC’s public code, and got down to work. I decided to work with “model 1” and specifically the model built using death rates. The only changes I made to the software were to parameterize the date - replacing instances of the date October 31st (encoded in the script as 305 - October 31st being the 305th day of the year) with the variable “treatment_date”, and changing the labels and graphs accordingly. Here’s my fork of CRRC’s repo, with the customized script added. I then ran the script for the dates October 18th, October 31st (the original date used by CRRC), November 7th, and November 15th. Broadly speaking, the results were the same: the real, observed Georgia deviates significantly from the virtual, modeled Georgia given a “treatment” at any of these dates. This means that the effect G&S attribute to elections - on October 31st - is also approximately equally attributable to an unspecified event on October 18th, November 7th, and November 15th. In fact, the largest effect by far as measured by the mean MSPE was for November 15th.
Here are four graphs generated by the script, lined up side-by-side. Each graph shows the gap between the predicted and actual number of deaths per million. As you can see, the shape is similar, but the graph gets somewhat lower over time. I suspect this is just an artifact of using a predictive model - these models become less accurate with time, because small errors compound over time, so the more time between the treatment date and the effect you’re predicting, the larger the error will be. Or, to think of it another way, as you approach November 15th, the predictive model starts to “figure out” that Georgia is going to have a large peak, and therefore predicts it more accurately.

What this picture shows is that the model is not picking up an event that occurred specifically on October 31st, 2020. Instead, you’re getting basically the same effect for a range of dates around the beginning of the second wave. This is more consistent with the hypothesis that an ongoing policy or environmental variable was responsible for Georgia’s extra cases, rather than a single event in this time period.
As an aside, I had a lot of fun working with R - it turned out to be a lot less intimidating than I had been led to believe by some of my linguist friends. I appreciate features like the ability to run and rerun snippets, dynamic typing, and RGui’s functionality for installing libraries. It was actually way easier than any project I’ve ever done in Python.
A Question of Fundamentals
Fundamentally, the CRRC bulletin asks us to believe that in the absence of elections, cases would have peaked in early November and then plateaued or declined for the rest of the year, with Georgia’s curve ultimately coming to resemble Hungary’s or Bulgaria’s. But in this counterfactual world, something would have to cause this peak in early November.
In reality, the peak occurred only after the government imposed a lockdown, which it only did because the case count got so high that hospitals could not keep up with new admissions. Even if the election had been a superspreader event - which, I stress, the evidence is less than clear on - the only effect it would have had would have been to hasten the onset of hospital overflow. The only way the election could realistically have changed this outcome would be if the other party had won and instituted a lockdown immediately rather than waiting for hospitals to overflow.
As I said before, it is important to conduct elections safely - enforcing masking and distancing rules, especially indoors - and on this point, I am in complete agreement with the CRRC bulletin. But for me, the takeaway from this method is that now we have good numbers for how many cases were caused - and how many lives were lost - due to Georgia’s unnecessary delay in implementing reasonable covid restrictions during the second wave. I’d consider using the same method to assess Georgia’s performance in the 4th wave, once we’re completely out of it.
Thanks to CRRC, Dustin Gilbreath, and Givi Silagadze for putting in the work and sharing data-driven analysis of important issues in the interests of informed, scientific understanding. In the same spirit, I invite the authors - or anyone else - to comment on this article and tell me what I’ve missed or mistaken.